
Globalization Report 2020 – Where do the BTI countries stand?
Every two years, the Globalization Report of Bertelsmann Stiftung examines how well individual countries have benefited from the progressing globalization since 1990. 22 of the countries considered in the “Globalization Report 2020” are also assessed by the Bertelsmann Stiftung’s Transformation Index (BTI).
Globalization development between 1990 and 2018
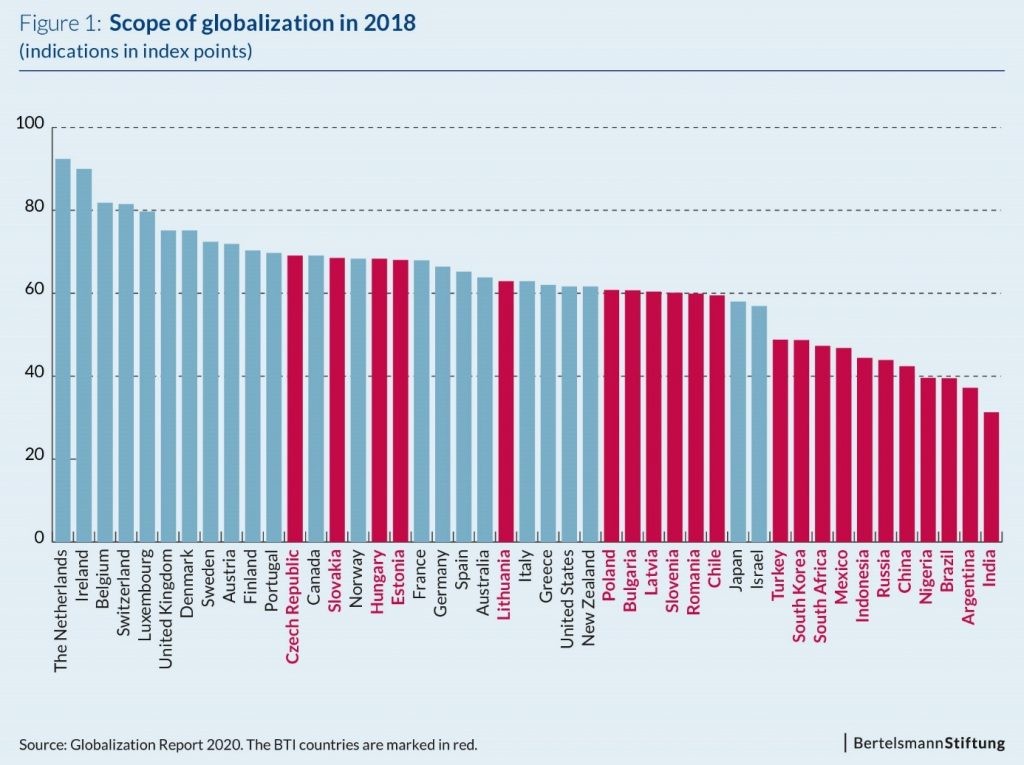
The scope of a country’s integration with the rest of the world is measured by an index that is very closely aligned with the established KOF Globalization Index of the Eidgenössische Technische Hochschule Zürich. It includes indicators of economic interdependence as well as social and political globalization. The period under observation in the “Globalization Report 2020” is from 1990 to 2018. The resulting data allows for the development of a Globalization Index for each country and year. Index values can range from 0 to 100. The higher the index value, the greater the integration of the respective country with the rest of the world.
Figure 1 shows that – with the exception of some Eastern European countries – most of the BTI countries included in the Globalization Report show the lowest degree of international integration. This means that these countries still have considerable potential for increasing their economic, social and political globalization.
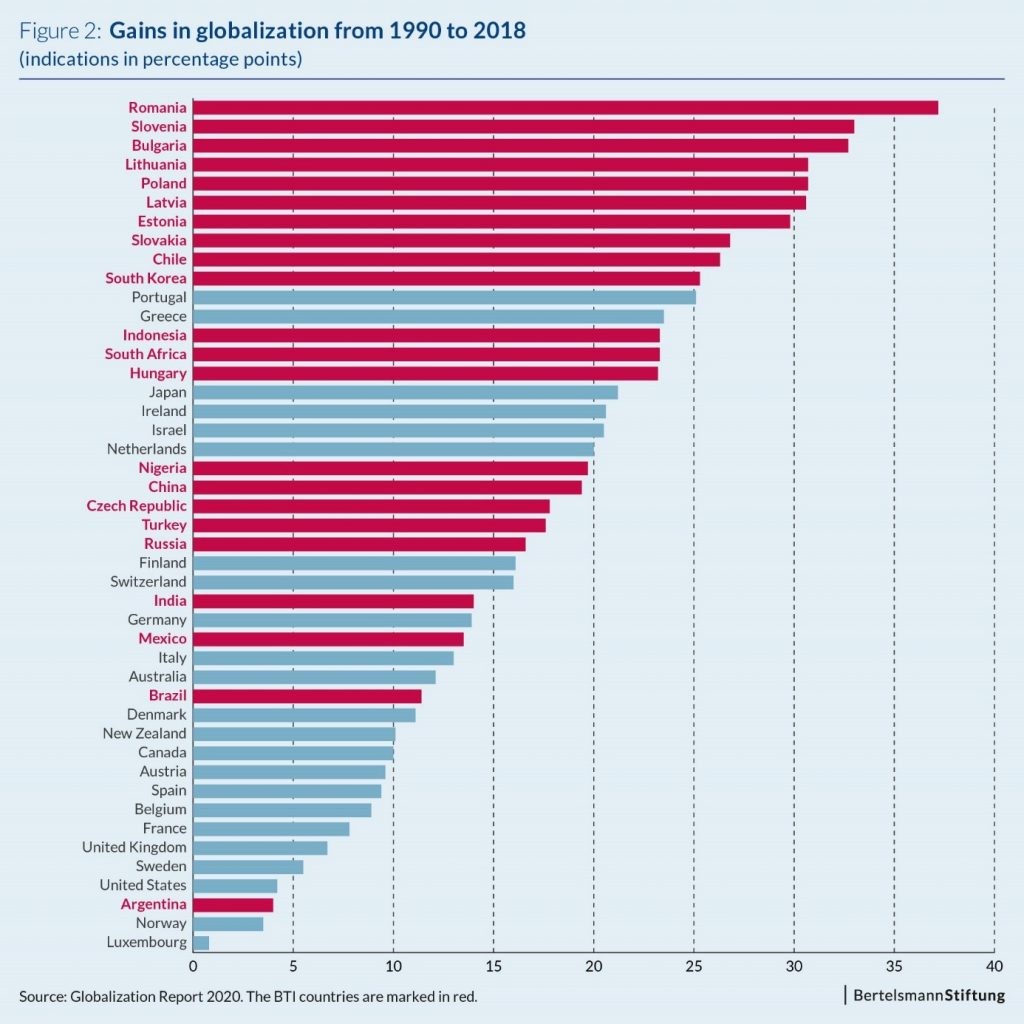
A look at the change in the international integration of the 45 countries with the rest of the world between 1990 and 2018 shows that many BTI countries have, however, been able to achieve above-average growth in globalization (see Fig. 2). Regarding Eastern Europe, there are of course two central reasons for this: the fall of the Iron Curtain and the EU expansion to the East.
Globalization and Growth
The premises of this study on globalization and growth is the proposition that an intensification of economic, social and political globalization increases the real gross domestic product (GDP) of an economy. The GDP corresponds to the value of all tangible goods and services produced in a country within one year. It thus provides information about the economic performance of a country.
In order to compare which country has been able to derive the greatest economic benefits from increasing globalization since 1990, it is calculated how large the absolute – i.e. expressed in euros – globalization-induced average GDP gain per capita and year was over the period under consideration. The GDP per capita is chosen as an indicator because it is more meaningful for the prosperity of the citizens than the GDP of the entire economy.
Three steps are necessary to calculate the effect of globalization on real GDP per capita:
- First, the international integration of the 45 countries analyzed from 1990 to 2018 is measured by the Globalization Index, as already explained.
- Subsequently, statistical methods are applied to determine whether a systematic correlation can be found between the change in the Globalization Index and the growth rate of the real GDP per capita, and if so, how strong this correlation is. The calculations reflect the following result for the 45 economies under consideration in the period from 1990 to 2018: If the Globalization Index rises by one point, the growth rate of real GDP per capita increases by about 0.3 percentage points.
- Finally, a hypothetical development is calculated in which the value of the Globalization Index for all 45 countries remains at the 1990 level between 1990 and 2018. This means that the globalization-induced growth gains resulting from the actual progress of globalization are deducted.
The annual gains in GDP that a country was able achieve from 1990 to 2018 due to globalization are totaled up and then distributed evenly across all 28 years of the period in question. The resulting figure indicates a country’s absolute average annual GDP gain per capita – i.e. expressed in euros – due to globalization.
Absolute globalization-induced GDP gains
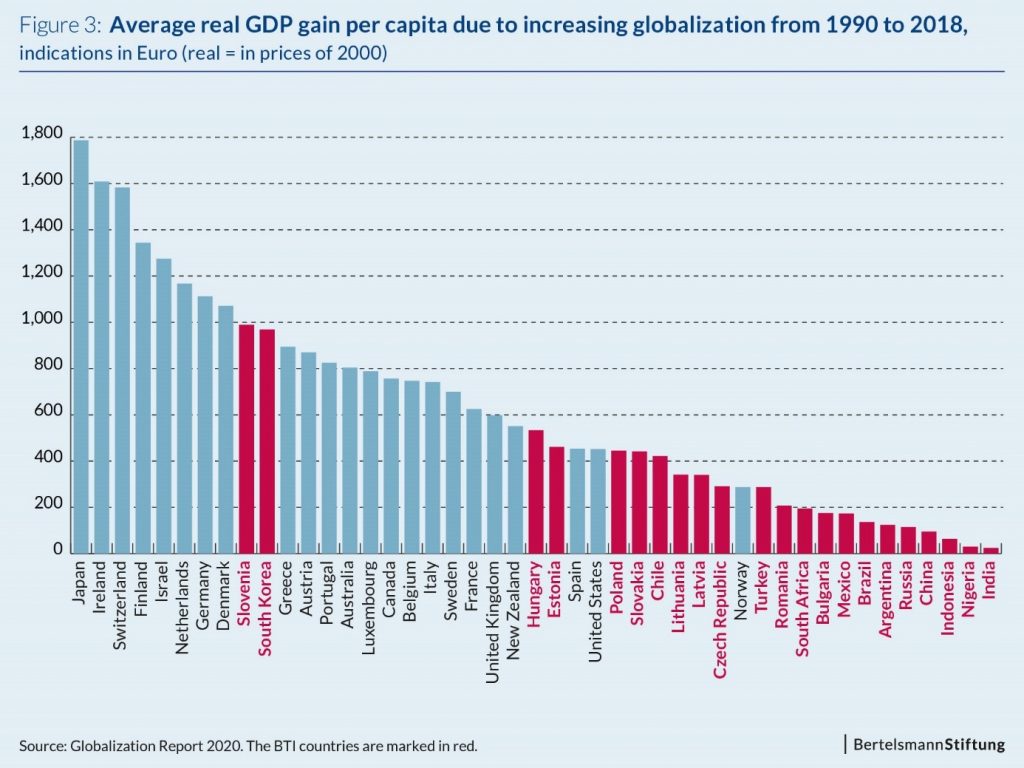
The values for the globalization-related average annual gains in real GDP per capita vary considerably among the 45 countries (Fig. 3): The largest average income gains per capita and year are recorded in Japan (around 1,790 euros), Ireland (around 1,610 euros) and Switzerland (around 1,580 euros). The large emerging markets are clustered at the lower end of the scale when measuring globalization gains like this.
There are three main reasons for these differences:
- The starting level of GDP per capita: At an initial value of only 2,000 euros (corresponding roughly to the value of Romania in 1990), even a ten percent globalization-induced increase in income merely leads to a growth of 200 euros. An increase of only two percent at a GDP per capita of 40,000 euros (Switzerland’s starting point) means a higher absolute growth of 800 euros.
- The extent to which globalization has changed over the period under consideration: The stronger the globalization index rises over time, the greater the growth gains due to globalization. Countries that started out with a high index score in 1990 have little space remaining for further globalization gains. This also means that the GDP increases caused by progressing globalization remain relatively small.
- The timing of the Globalization Index gains: If a country’s index value grows only in the last year of the period under consideration, it can only achieve a globalization-induced growth increase in that one year. On the other hand, a country that increases its globalization in the first year of the period analyzed raises its GDP per capita to a higher level that is maintained through all subsequent years, generating an increase in income induced by globalization for each and every year.
Relative globalization-induced GDP gains
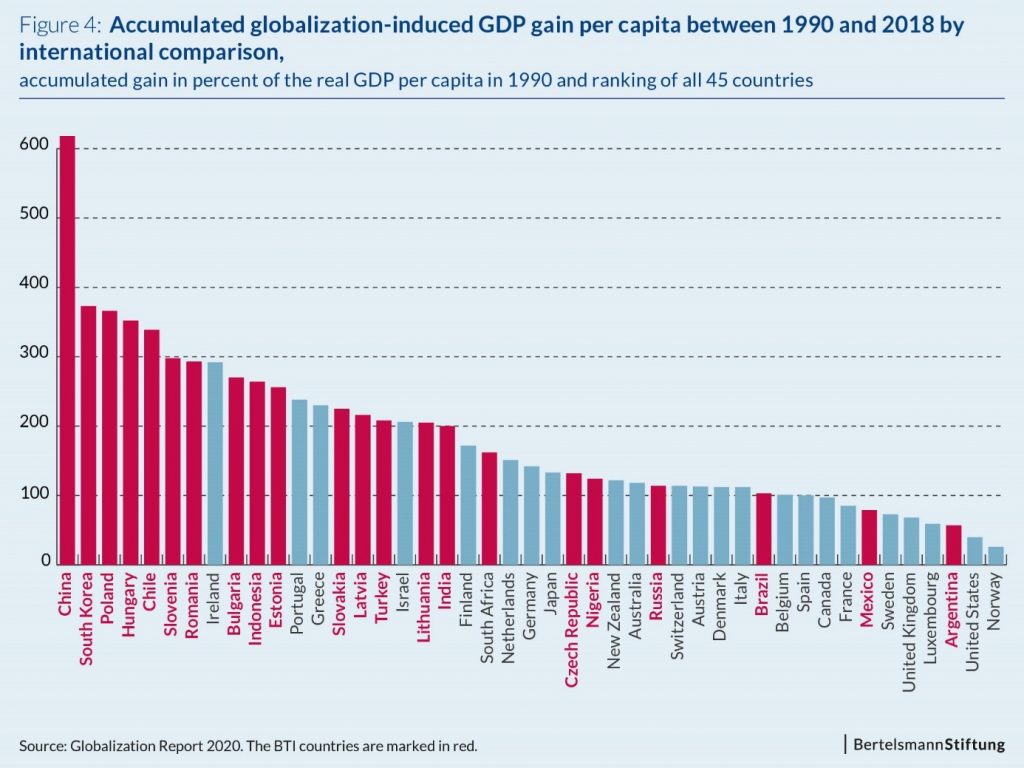
However, the fact that the absolute globalization-induced GDP growth of most BTI countries is relatively low by international standards does not mean that globalization is irrelevant for these countries. Quite the opposite: If GDP gains expressed in euros are put in relation to the starting levels of the respective real GDP per capita, the ranking of the countries with the highest growth rates changes drastically (Fig. 4). This can be illustrated using the example of China:
- China’s cumulative globalization-induced real GDP gains per capita between 1990 and 2018 amount to around EUR 2,660. China thus makes only 42nd place when compared to all 45 countries.
- However, if the same amount is compared to China’s real GDP per capita in 1990 – which was 430 euros – this cumulative monetary benefit from globalization represents nearly 620 percent of the 1990 GDP level. This is by far the highest value of all 45 countries. South Korea follows in second place with around 370 per cent.
Nine BTI countries are among the top ten countries in figure 4. 16 out of 22 countries are ranked in the upper half of this ranking, illustrating the importance of advancing globalization for these countries.
Implications for economic policy
In order for globalization to unfold its welfare-enhancing effects, certain standards must be adhered to when designing the legal framework for the cross-border exchange of goods, services, production factors and technologies. This includes, among other things, the reduction of import restrictions that only protect domestic companies for clientelist reasons. In turn, restrictions that serve to protect only the domestic consumers should be preserved. In order to prevent a “race to the bottom”, labor, social and other protection standards achieved must not be abandoned for the sake of intensifying international trade.
Fair distribution of the increased global material wealth produced by globalization between countries is essential as well. Like its predecessor studies, the “Globalization Report 2020” has shown that the developed industrialized nations have benefited the most from globalization so far in absolute terms of real GDP per capita as an indicator. In order to ensure that the promotion of international trade allows emerging markets and developing countries a greater share of the economic benefits of the international division of labor, it would be helpful, for example, if industrialized countries opened their markets to processed products from developing countries without demanding the same in return (since developing countries are generally unable to enter competition with industrialized countries on equal terms). Industrialized countries should also reduce, or even discontinue, their subsidies for agricultural products in order to eliminate the distortion of competition towards developing countries depending heavily on agriculture. A fairer distribution of trade profits could also be achieved by expanding the financial support of rich industrialized countries for less developed economies to enable these countries to afford the required infrastructure, education, and production facilities.
Such steps taken by highly developed industrialized countries should not, however, lead to the governments of emerging markets and developing countries being relieved of their obligations. Foreign direct investment is an essential prerequisite for improving integration of these economies, as it has an important share in financing investments fostering an improved economic performance. However, foreign investors need legal certainty in the respective country targeted for investment. In this respect, private- and market-economy structures that enable free and fair competition in the sense of inclusive economic development must be distinguished from state-dirigiste, market-distorting or patronage-based structures that merely adopt certain aspects of the capitalist economy in order to realize efficiency gains in the service of a closed political system.
Note: This blog post is based on the publication „Globalization Report 2020 – How do developing countries and emerging markets perform?“
